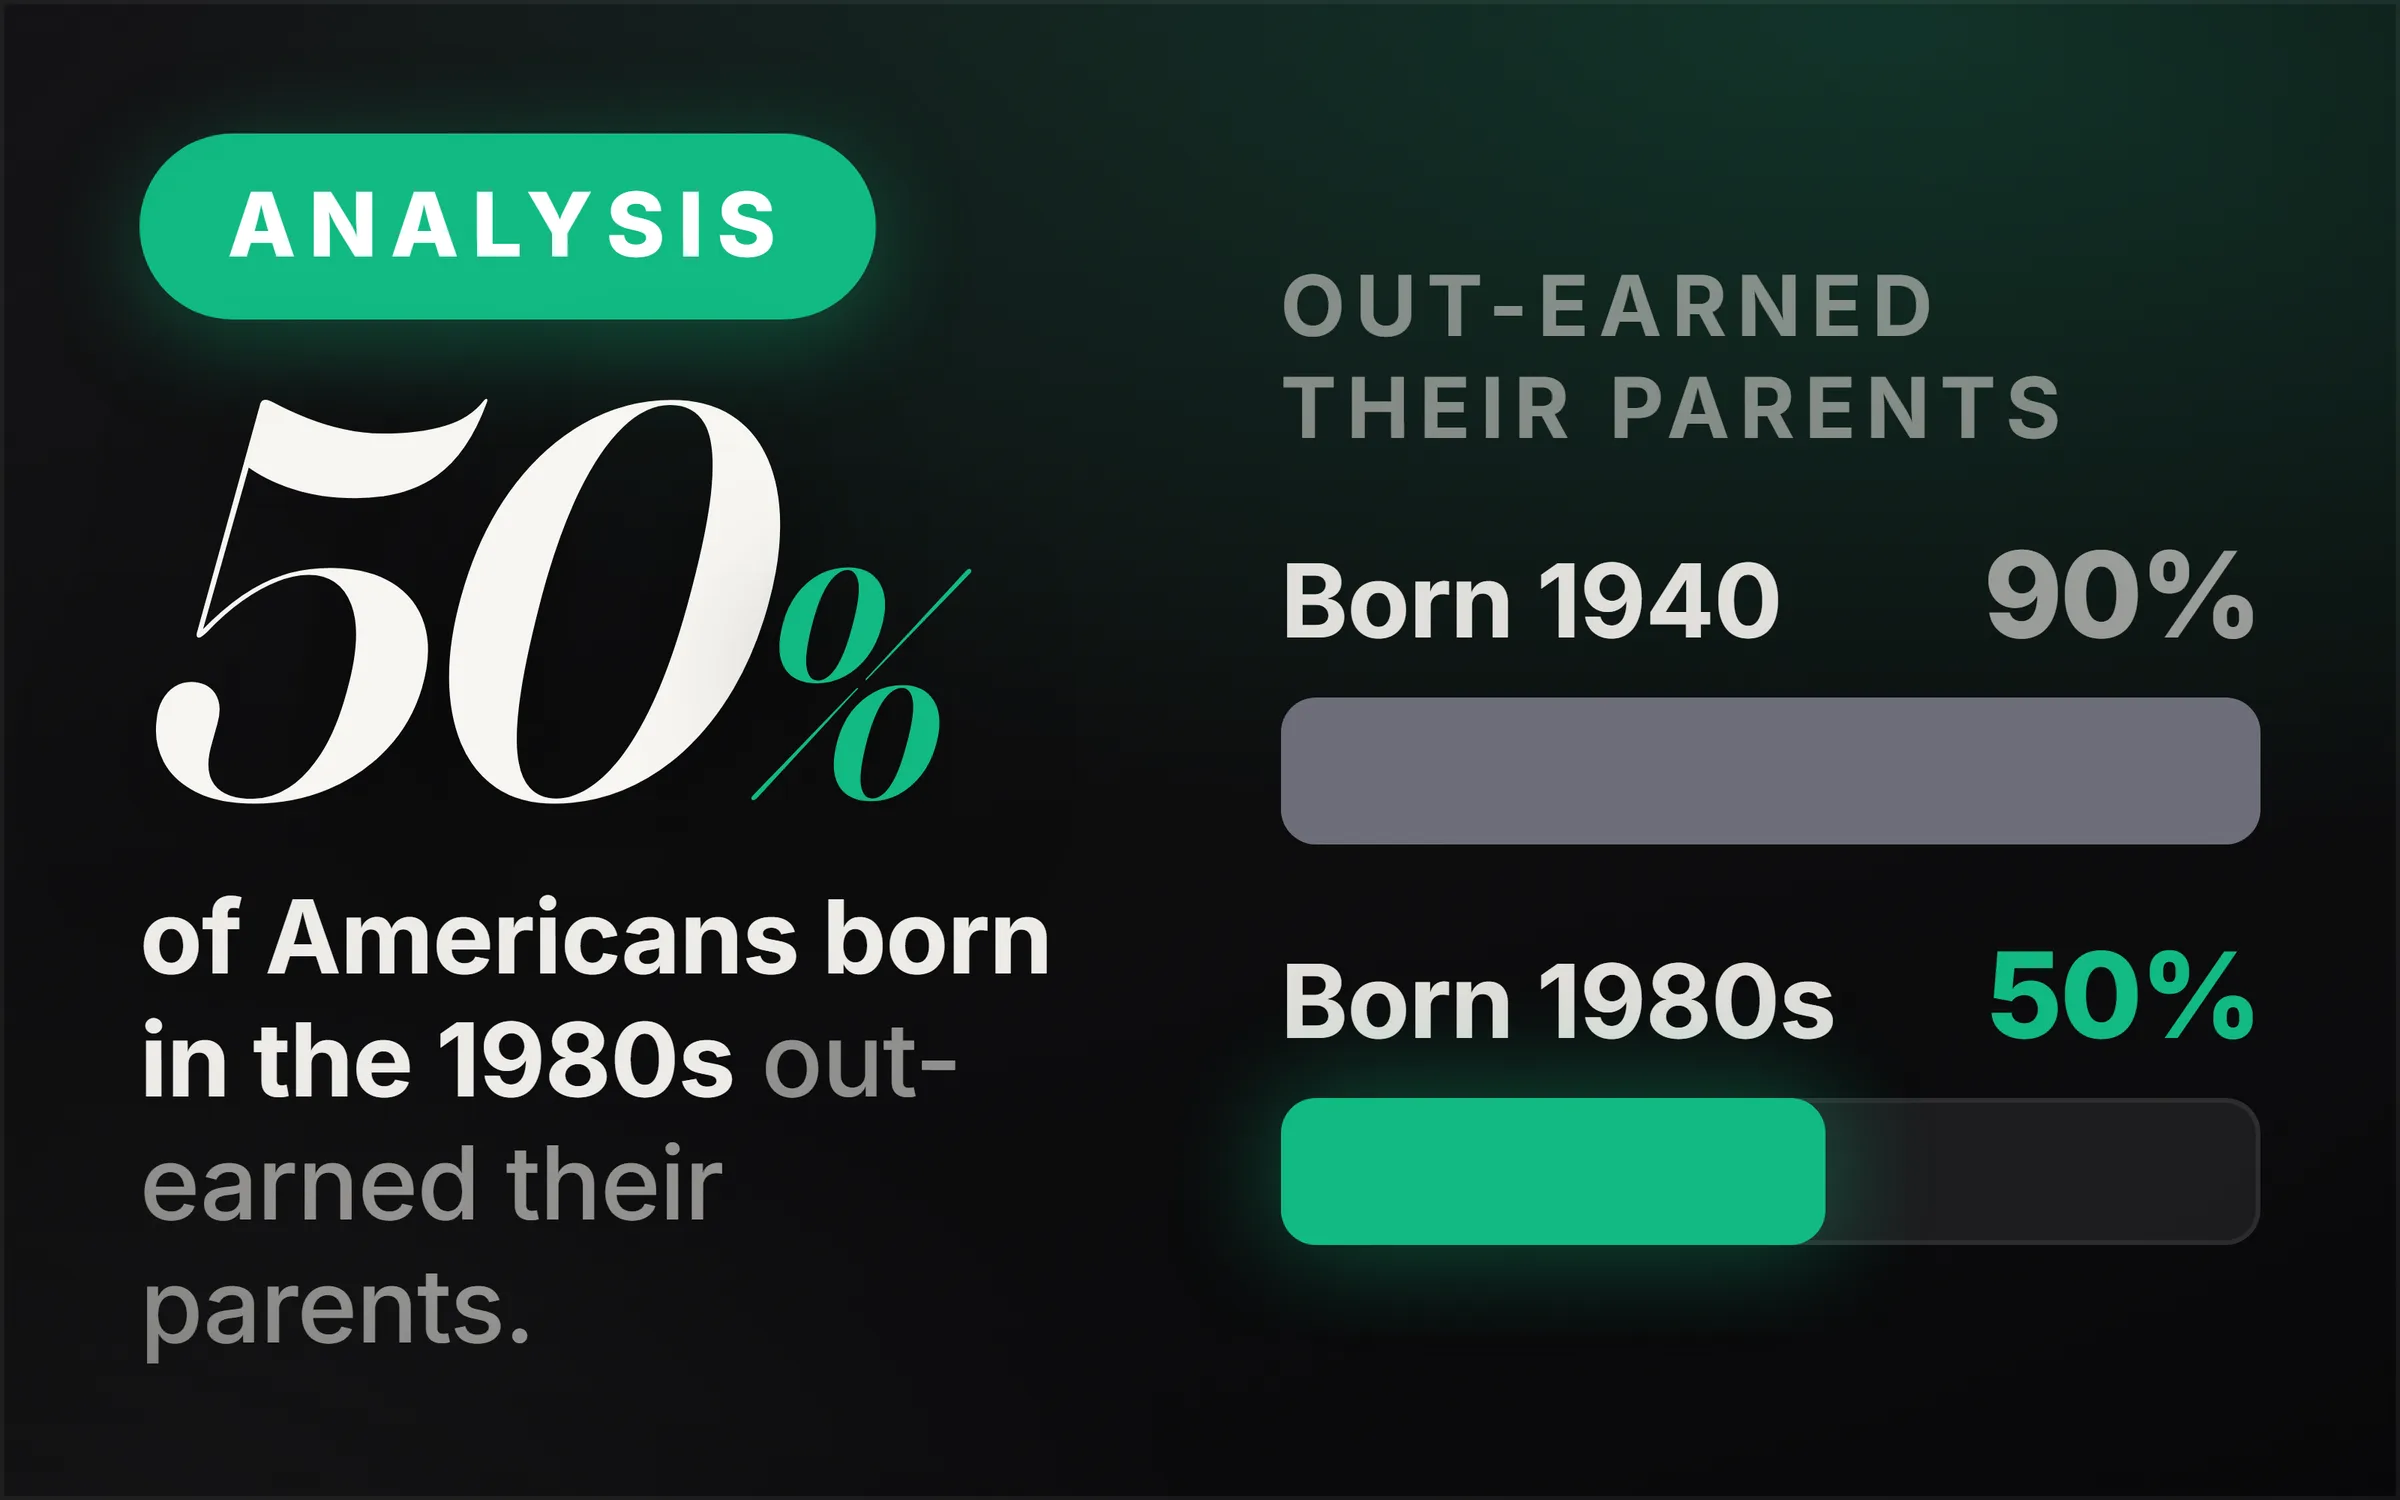
About 90% of Americans born in 1940 earned more than their parents did at around age 30. For Americans born in the 1980s the figure is about 50%. Raj Chetty's team measured it from tax records in Science in April 2017, and found that slower growth explains little of the fall. How growth was divided explains most of it.
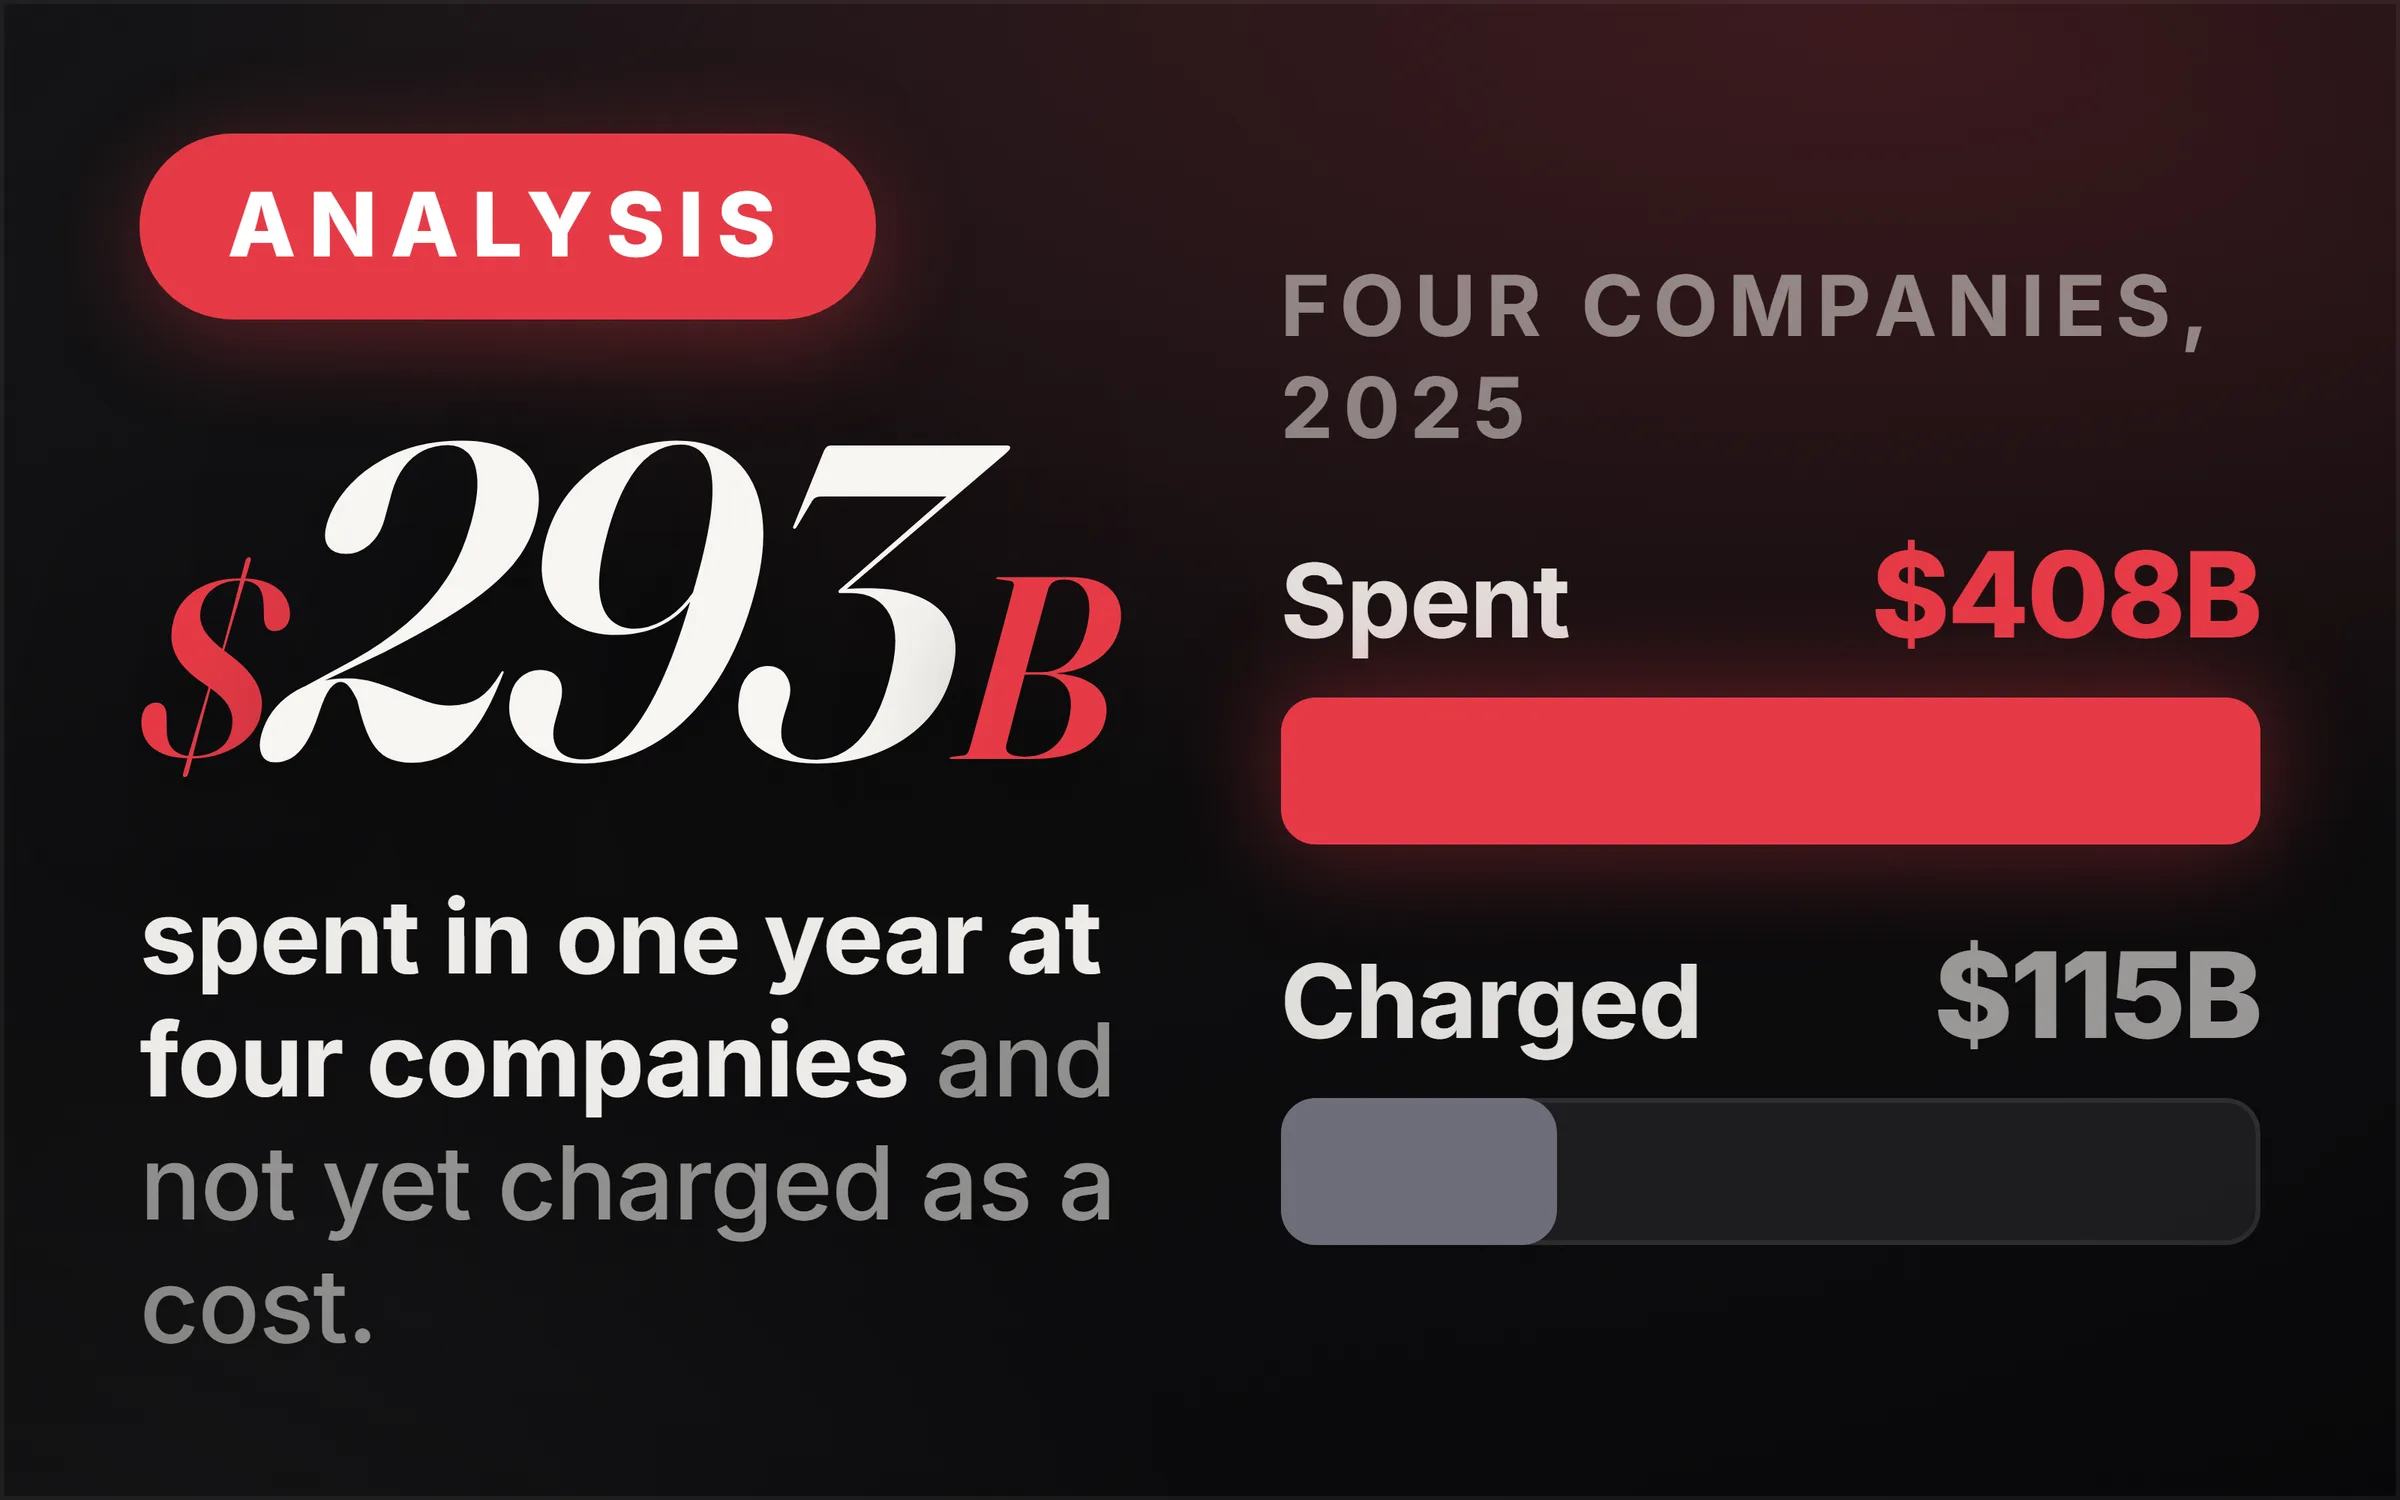
That second finding is the reason this is worth reading. The team tested both explanations directly. Giving today's generation the growth of the 1940s only lifts mobility from 50% to 62%. Keeping today's growth but dividing it the 1940s way lifts it to 80%. What follows is that measurement, then the rules written down in the years the division moved, with the honest limits on how far each connects.
The film does not claim anyone planned this, does not claim these rules are the cause, and does not argue that any should be repealed. Where it joins the paper's finding to a rule, it says on camera that the join is its own. This article follows the same rules.
Is the American dream fading?
By the most direct measure, yes. Raj Chetty's team combined census data with de-identified tax records and found about 90% of Americans born in 1940 out-earned their parents at around 30, adjusted for prices, against about 50% of those born in the 1980s. Across every plausible assumption, the 1940 figure never fell below 84% or rose above 98%.
Economists call this absolute mobility. It does not ask whether you became rich or moved up relative to anyone else. It asks the simplest promise a country can make: will you be better off than the home you grew up in? Measuring it needs two generations of income for millions of families, which is why nobody could do it properly until the 2017 paper in Science.
A stricter version, comparing fathers and sons on individual earnings rather than household income, shows the same fall, from 93% to 59%. Wherever you stand in the honest range, the 1980s figure is close to a coin toss.
Why did mobility fall if the economy kept growing?
Because of how growth was shared, not how much there was. Chetty's team gave the 1980s generation the faster growth of the 1940s while keeping today's distribution: mobility rose only to 62%. Keeping today's actual growth but distributing it as in 1940 raised mobility to 80%, reversing more than 70% of the collapse without adding a dollar.
The obvious story is that the post-war boom ran out of fuel. The paper tests it and it fails. Under today's division, getting back to 1940s mobility would require the US economy to grow more than 6% a year, indefinitely. No large, rich country has done that.
The paper stops there. It measures an outcome and runs two tests. It does not name a law, a rule or a regulator, and it was not trying to. A division, though, has to be written down somewhere, which is where the rest of this article goes looking.
How did the 401(k) replace the pension?
Through a clause written for something much narrower. The Revenue Act of 1978 added section 401(k), meant to let employees defer part of a bonus. It took effect on 1 January 1980, and 1981 tax guidance confirmed ordinary salary could go in too. Benefits consultant Ted Benna built the first plan from it.
The change moved a whole category of risk. A defined-benefit pension promises a set amount for life, and if the sums go wrong it is the company's problem. A defined-contribution plan defines only what goes in, and if the market goes badly it is yours. Benna, generally called the father of the 401(k), has spent much of the past decade saying he regrets what it became, particularly the investment fees, and that it was never meant to be the main way Americans save. His regret is not evidence about income distribution. It is evidence that the clause was not designed to carry what was loaded onto it.
The filings show the result. By 1995 more Americans were in defined-contribution plans than traditional pensions. In 2024 filings there were about 90,350 401(k) plans against 6,676 defined-benefit plans. The Bureau of Labor Statistics found in March 2025 that 72% of private-sector workers have access to any workplace retirement plan, 70% to a defined-contribution plan and 14% to a pension. Access is 90% at firms with 500 or more workers and 59% at firms with under 100.
The largest plan administrator's 2024 report puts the average balance at about $134,000 and the median at $35,000. The average is nearly four times the middle, which only happens when a few large accounts pull it away from most people. For those 65 and over, the average was $272,000 and the median $88,000.
When did stock buybacks become legal?
On 17 November 1982 the Securities and Exchange Commission, under chairman John Shad, adopted Rule 10b-18. It did not declare buybacks legal. It created a safe harbour: a company buying its own shares within four conditions would not be treated as manipulating its price, which is how the practice had largely been viewed before.
The four conditions: one broker per day; no purchases at the open or in the last half hour of trading; no bidding above the highest independent bid or last sale price; and no more than 25% of average daily volume over the prior four weeks. The Commission's own staff later described the change as an about-face.
After 1982 buybacks became one of the largest uses of corporate cash in America. In June 2022 buybacks by the 500 largest US companies passed $1 trillion over twelve months for the first time. Over the decade to 2023 they spent more than $4 trillion on buybacks and about $3 trillion on dividends, together about 106% of profits. In 2024 buybacks hit a record $942.5 billion.
That does not prove the money came out of wages, since corporate cash is not one pie with a wages slice. What it shows is that a use of cash that was legally hazardous before November 1982 became one of the biggest afterwards, and what changed in between was four conditions and a promise not to prosecute.
Who owns the stock that buybacks benefit?
Mostly the wealthiest households. Federal Reserve distributional data, published quarterly since 1989, show the top 1% of US households hold roughly half of all corporate equities and mutual fund shares, the top 10% close to 90%, and the bottom half about 1%.
There is a real complication. The 401(k) turned millions of ordinary workers into shareholders, so some sliver of every buyback lands in their accounts. Two rules written 15 years apart by different institutions interlock: one moved retirements into the stock market, the other moved corporate cash towards it. The pipe is real. Its width depends on how much you already had.
Why is CEO pay so high?
Partly because two rules meant to restrain it had the opposite effect. In 1993 Congress capped the tax deduction for executive pay at $1 million under section 162(m), but exempted performance pay set by outside directors and approved by shareholders. Stock options passed all three tests, so pay moved into equity, which has no ceiling.
One of the standard papers on the cap names the law of unintended consequences in its own title, and finds firms shifted pay from salary to options after 1993 while total compensation rose. Nobody had to want that. The incentive produced the behaviour on its own.
The year before, in 1992, the SEC under Richard Breeden required a standard Summary Compensation Table in every annual filing, on the theory that sunlight restrains pay. Once pay sat in comparable tables, boards benchmarked against peers, and research finds around 90% of major US companies target executive pay at or above their peer median. If nine in ten aim at or above the middle, the middle rises every year. Economists call it the Lake Wobegon effect. By 2006 the SEC was requiring companies to disclose how they chose their peer groups.
The ratio of CEO pay to typical worker pay at the largest companies was about 21 to 1 in 1965, 31 to 1 in 1978, about 380 to 1 at the 2000 peak and 281 to 1 in 2024. It came down, largely with the stock market, since so much pay is equity. It remains roughly nine times its 1965 level.
The famous chart of productivity and pay splitting apart in the 1970s is not used here, because it is genuinely contested, partly over which inflation measure is applied to each line. The mobility counterfactual has no such problem: it asks one question of the same tax records twice.
What is the case for buybacks, stock pay and 401(k)s?
A strong one. A company with more cash than good ideas does better returning it than empire-building, and buybacks can pause in a bad year where dividend cuts are punished. Paying managers in shares aligns them with owners. Pensions were promises that bankruptcies broke, and they tied workers to one employer, while a 401(k) is portable.
The equity figures cut both ways too: a rising market now reaches tens of millions of 401(k) holders, not only the already rich. Every one of these arguments is true, and none of them says the division did not change. They say the changes were reasonable, which mostly, individually, they were. The narrower point is that they were rules, with authors and dates, and between them they moved something nobody voted on.
Are the rules changing now?
Yes, mostly back the other way. On 5 August 2015 the SEC adopted the CEO pay ratio rule, first reported in 2018 filings. In 2017 Congress repealed the performance-pay exception in section 162(m). In 2022 it imposed a 1% excise tax on buybacks after 31 December 2022. In May 2023 the SEC adopted a buyback disclosure rule requiring daily records, quarterly filing and stated reasons.
That last rule did not survive. The US Chamber of Commerce and two Texas business associations challenged it in the Fifth Circuit, which held on 31 October 2023 that the SEC had not adequately answered objections or analysed costs and benefits, and gave it 30 days to fix the defects. The SEC said it could not in time, and the rule was vacated on 19 December 2023. The court's standard is a real one. But the 1982 rule that opened the door has stood for 43 years, and the rule that would only have described what came through it lasted seven months.
Does anything go the other way?
Yes. A 2024 study by the same research group, looking at Americans born 1978 to 1992, found the gap by class widened by around 30%, while the gap by race narrowed by around 30% for children from low-income families, with Black Americans' earnings rising at every level of parental income. One line got worse and another got better.
Mobility studies across North America and Europe also differ widely, sometimes by 10 to 15 percentage points depending on the records used. The American line is one country's arithmetic, not a law of nature, which is itself evidence that these are choices rather than a tide.
And there is a limit on what anyone can know yet. The measurement stops at people born in 1984, because earnings settle around 30 and tax records take years to assemble. There is no figure for people born in the 1990s, and anyone who offers one is making it up. We can read every rule of the last 25 years. We cannot yet see what they did to the children raised under them. For the generational theory people often reach for to explain moments like this, see the Fourth Turning theory, tested.