To revive a dying YouTube channel, chase watch time rather than views or subscribers. This channel fell from 2,505 watch hours in 2024 to 322 in 2025 after it stopped uploading. In 2026, long-form made up 14% of its views but 71% of its watch time, and one suggested-video view was worth about 31 Shorts views.
I made a video about bringing this channel back from the dead. Then I pulled the actual analytics to write this article, and the data contradicted two things I said in it.
Both corrections are in here, in their own sections, because a comeback story that only reports the flattering numbers is not worth reading. What follows is eight years of one channel, the last three of them measured month by month, with the figures exactly as YouTube reports them on 13 August 2026.
What does a dying YouTube channel look like in the data?
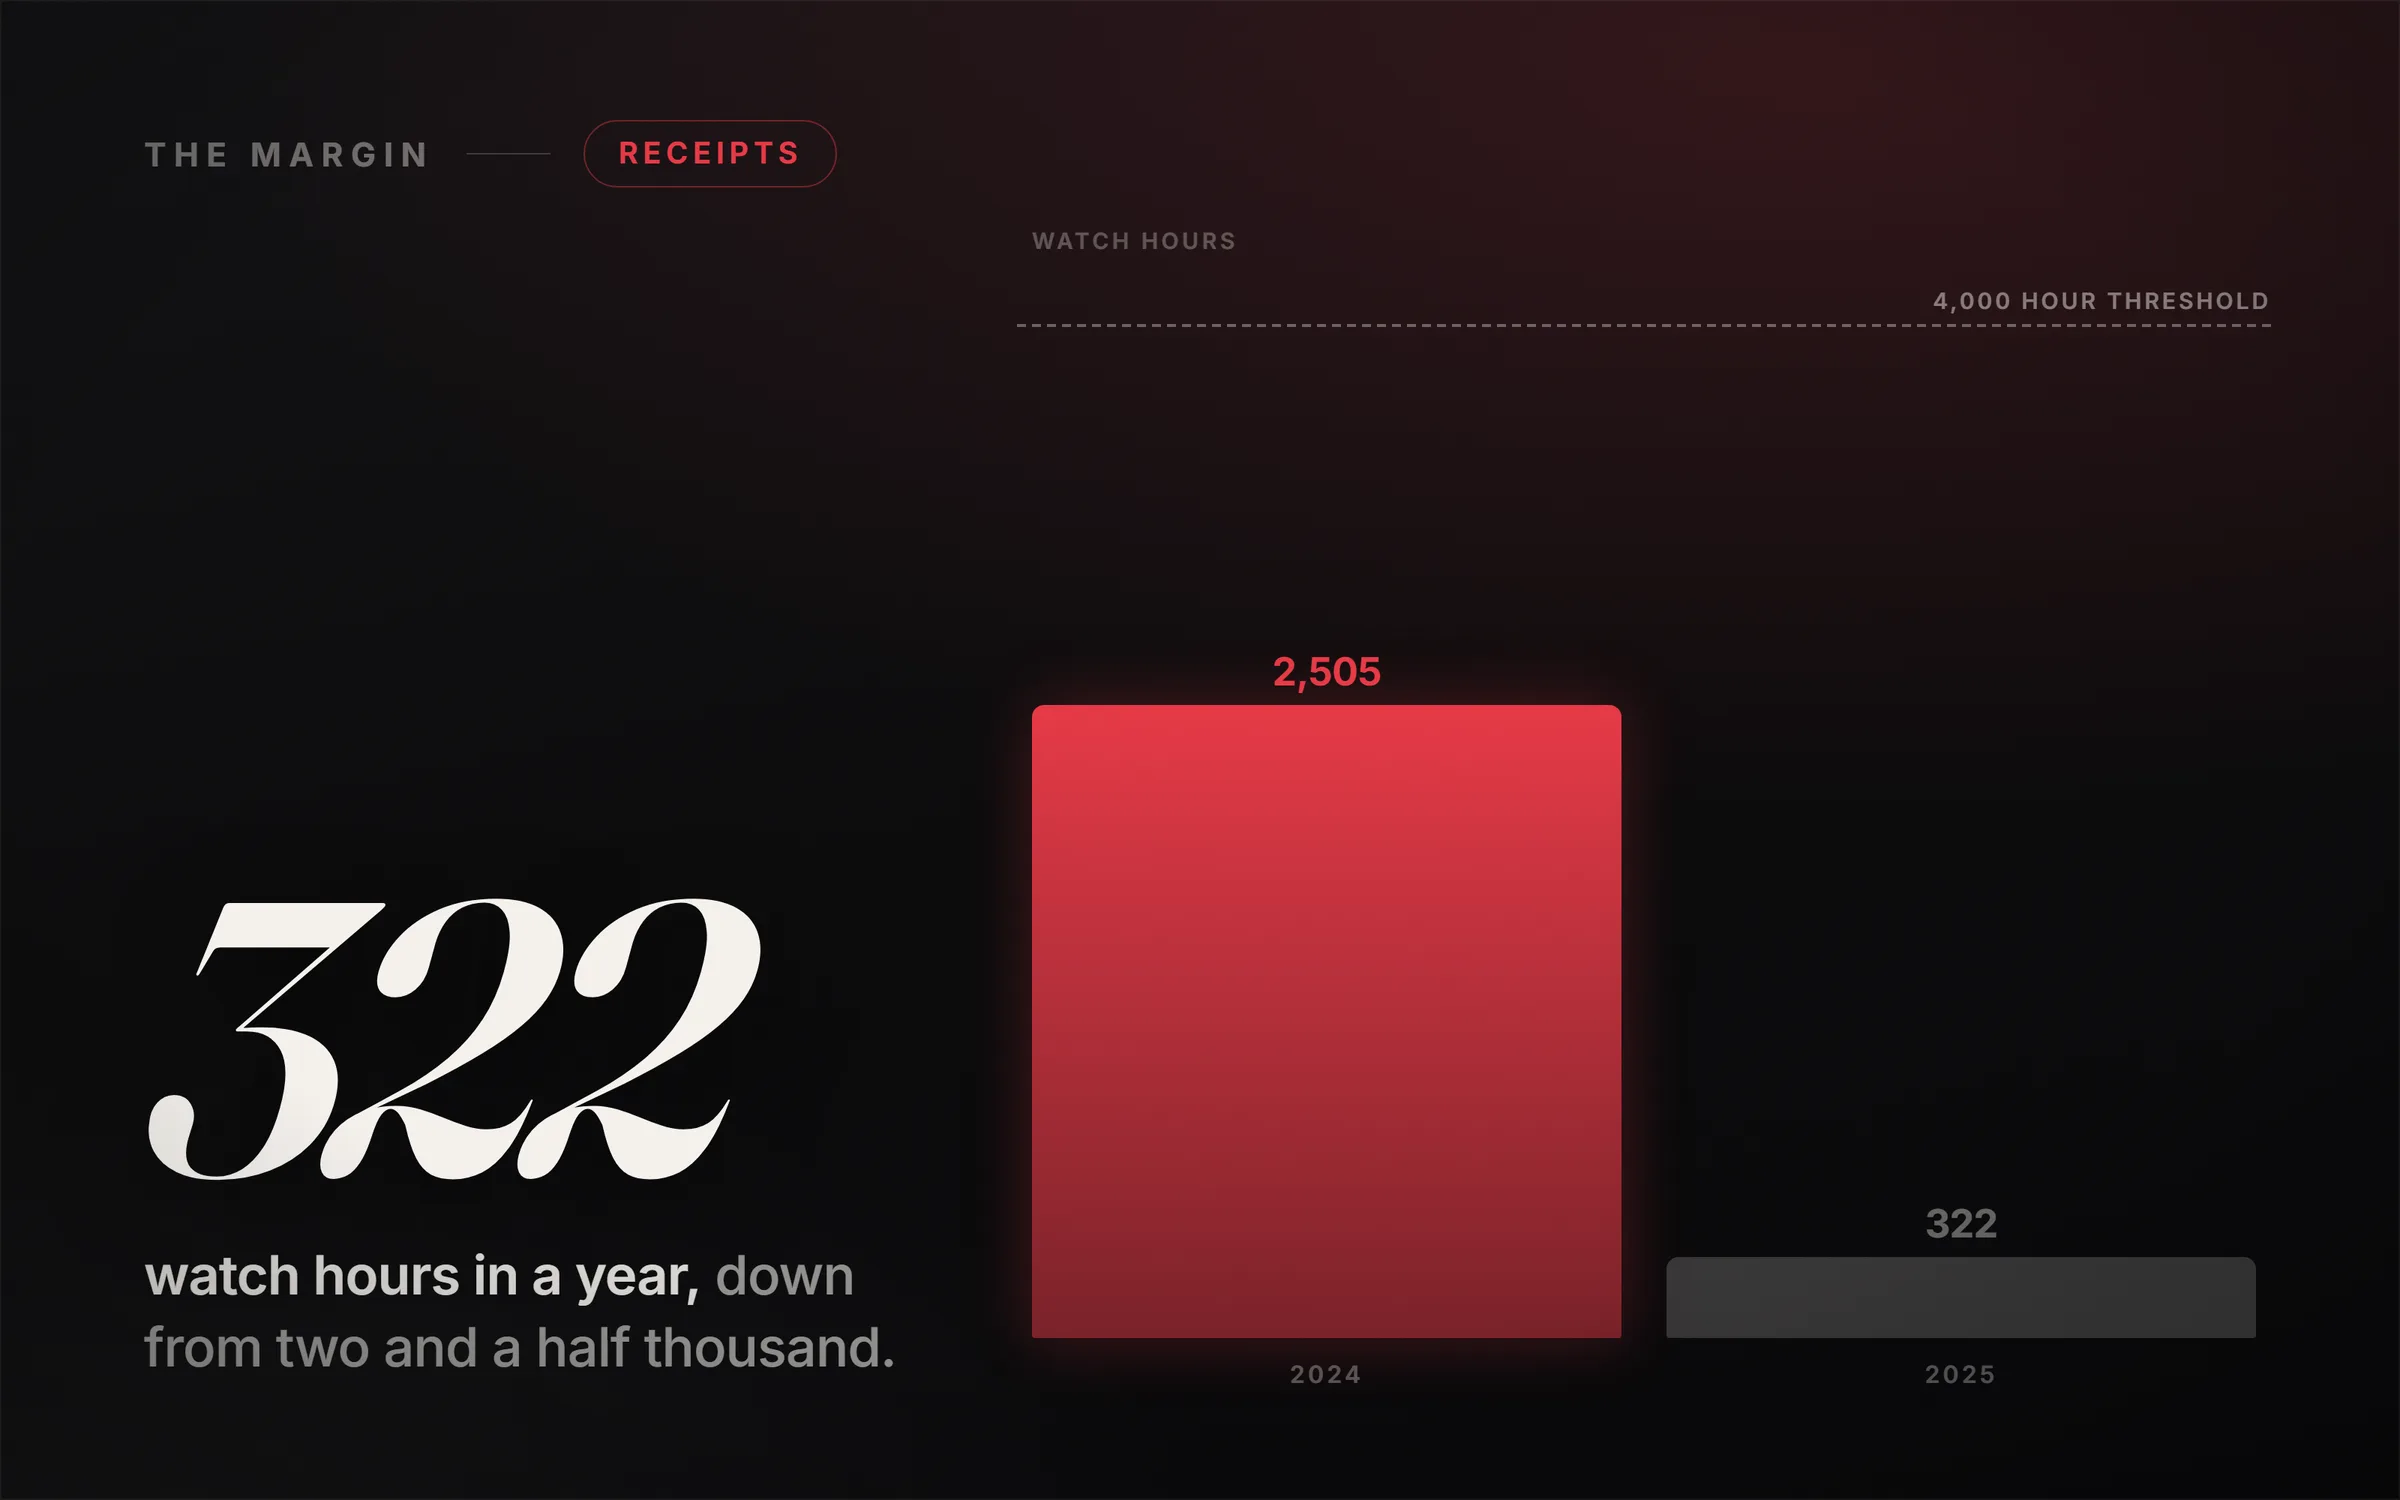
Watch hours falling off a cliff. This channel did 2,505 watch hours in 2024 and 322 in 2025, an 87% collapse caused by nothing but stopping uploads.
The channel started on 6 March 2019. It has 58,800 subscribers, 688,641 lifetime views and 217 published videos as I write this. On the surface that is a real channel. Underneath, here is what happened when I stopped uploading.
| Year | Views | Watch time |
|---|---|---|
| 2024 | 150,057 | 2,505 hours |
| 2025 | 22,130 | 322 hours |
| 2026 to 12 August | 48,837 | 162 hours |
The 2025 line is the one to sit with. Twelve consecutive months where the busiest month drew 2,650 views and the quietest drew 1,210. Watch time never cleared 2,200 minutes in a month all year, and December closed it out at 1,172 minutes. That is not a channel in decline. That is a channel that has finished declining and gone flat.
Nothing dramatic caused it. No strike, no algorithm change, no penalty. I stopped publishing, and the library did not carry me, because a YouTube library does not work the way people assume it does. More on that in a moment, because it turned out to be the single most expensive assumption I had.
The 2024 shape is worth reading too, because it is the shape of a slide rather than a cliff. January 33,152 views, February 37,053, March 29,101, then April 11,944, May 3,990, June 1,916. The floor arrived in about ninety days.
A YouTube channel does not coast. The moment you stop feeding it, the number it reports is not your past performance, it is your current publishing rate.
Was July 2026 the channel's best month ever?
No. February 2024 did 37,053 views against July 2026's 20,531, and nine times the watch time; July was the best month of 2026, not the best ever.
In the video I say, over a chart, that 20,565 views in a single month was "already the strongest month this channel has ever had."
That is wrong, and I only found out because I pulled 2024 and 2025 to write this. Analytics now reports that month as 20,531 rather than 20,565, because a figure read off a live dashboard settles slightly afterwards. The 34-view difference is not the problem. Here is the problem.
| Month | Views | Watch time |
|---|---|---|
| February 2024 | 37,053 | 34,244 minutes |
| July 2026 | 20,531 | 3,747 minutes |
February 2024 did 80 percent more views. On watch time, which is the number that actually matters, it did nine times as much from fewer than twice the views. Our comeback month has 55 percent of the peak month's views and 11 percent of its minutes.
The reason for the gap is the whole lesson of this article, so I will state it plainly rather than bury it: in 2024 those views were people watching videos. In July 2026 most of them were Shorts and community posts. Both are counted as views in the same column of the same dashboard. Only one of them builds anything.
I have left the video up as published. The correct claim is that July 2026 was the strongest month of 2026 by a wide margin, and that the recovery is real but is at roughly a tenth of the channel's historic peak on the metric that pays.
Which metric matters most when reviving a YouTube channel?
Watch time, not views. In 2026 so far, long-form was 14% of the channel's views and 71% of its watch time, and monetization is decided by watch time.
Here is the 2026 year to date, split by what the content actually was.
| Content type | Views | Watch time | Average view duration |
|---|---|---|---|
| Long-form video | 6,704 | 6,882 minutes | 61 seconds |
| Shorts | 19,579 | 2,180 minutes | 24 seconds |
| Community posts | 22,533 | 685 minutes | 14 seconds |
Long-form is 13.7 percent of the views and 70.6 percent of the watch time. Community posts are the single largest source of views on the channel this year and contribute almost nothing.
If you are chasing the Partner Program, the practical consequence is severe. Shorts Feed watch time does not count toward the qualified watch hours requirement, and community post views obviously do not either. So a dashboard that says 48,837 views for the year is describing about 115 long-form watch hours, and YouTube's own qualifying counter reads lower still.
This is the trap that catches people who "went viral" and wonder why nothing happened. A Short doing 50,000 views at 21 seconds of average view duration is roughly 290 watch hours if every second counted, and it counts zero toward the long-form threshold. The two ladders are separate, they have separate thresholds, and climbing one does not move you up the other.
The hours you already earned, and then destroyed
This one cost me and I have not seen it written down anywhere, so here it is precisely.
Pulling our trailing twelve months of long-form watch time through the API returned 228 hours. YouTube Studio's qualifying watch hours counter, on the same day, read 60.
The difference is watch time attached to videos that are no longer public. Early experiments I made private. Tests I unlisted. A handful I deleted outright. Every hour those videos earned went with them, and it does not come back if you republish, because the clock is the last 365 days and those hours are now spent.
If you are anywhere near a threshold, audit your channel for private, unlisted and deleted videos before you do anything else, and stop deleting things reflexively. An embarrassing old video that nobody watches is worth more than no video, because it is still counting.
Where does YouTube watch time actually come from?
Mostly from suggested long-form views. Over six weeks, one suggested-video view was worth about 31 Shorts views in watch time; Shorts brought 81% of views but only 20% of minutes.
This is the table that changed how I plan. It covers 1 July to 12 August 2026, all sources, ranked by the thing that matters rather than the thing that flatters.
| Traffic source | Views | Watch time | Average view duration |
|---|---|---|---|
| Suggested video | 767 | 1,369 minutes | 107 seconds |
| Shorts feed | 18,759 | 1,090 minutes | 21 seconds |
| Subscribers | 745 | 886 minutes | 72 seconds |
| YouTube search | 905 | 608 minutes | 58 seconds |
| External links | 503 | 486 minutes | 64 seconds |
| Notifications | 524 | 302 minutes | 37 seconds |
Shorts delivered 81 percent of all views and 20 percent of all minutes. Suggested video delivered 3.3 percent of the views and 25 percent of the minutes, making it the largest single source of watch time on the channel.
Per view, suggested was worth 1.79 minutes and the Shorts feed was worth 0.058 minutes. One suggested-video view is worth about 31 Shorts views.
I do not read that as an argument to abandon Shorts. Shorts are how strangers meet you, and 18,759 of them met us in six weeks. I read it as an argument to stop treating the two numbers as one number. Shorts buy reach. Suggested buys the business. If you are optimising a comeback, the only view count worth watching daily is the suggested line.
One more thing in that table that I did not expect. Notification-driven views had the lowest average view percentage of any meaningful source, at 12.6 percent, with subscriber-driven views next at 20.15 percent. External links came in at 42.6 percent. The people who chose to come from outside YouTube watched more than twice as much of the video as the people YouTube pinged.
Why does retention decide how far a video travels?
Because YouTube shows every upload to a small test audience first, and how far it spreads depends on what that audience does, not on how many subscribers the channel has.
The mechanism I got right in the video is the one worth repeating. Every upload is handed to a small test audience first, and how far it travels is decided by what that audience does, not by how many subscribers you have. That is why a dead channel can come back at all, and it is also why 58,800 subscribers bought us nothing.
The number that audition scores is retention. Our monthly average view duration across 2026, all formats combined:
| Month | Views | Watch time | Average view duration |
|---|---|---|---|
| January | 618 | 443 minutes | 43 seconds |
| February | 3,457 | 875 minutes | 38 seconds |
| March | 714 | 644 minutes | 57 seconds |
| April | 5,960 | 912 minutes | 28 seconds |
| May | 2,054 | 525 minutes | 37 seconds |
| June | 12,827 | 871 minutes | 25 seconds |
| July | 20,531 | 3,747 minutes | 45 seconds |
| August 1 to 12 | 2,676 | 1,720 minutes | 70 seconds |
Look at June against August. June drew nearly five times the views of the first twelve days of August and produced half the watch time. June's average view duration was 25 seconds, the worst month of the year, because June was almost entirely Shorts and posts. August is running at 70 seconds, the best of the year, on a fraction of the views.
If I judged the comeback on views I would conclude August is a disaster. It is the best month we have had. The honest signal of a recovering channel is watch time per view, and it moves in the opposite direction to the number on the front of the dashboard.
The practical change that produced it was small and I recommend it without reservation: stop setting the stage. The first thirty seconds carry more weight than the entire back half of a video, so open on the result and earn the rest afterwards. Every video I have published since making that change has held longer than every video before it.
Do consistent YouTube uploaders really grow 67% faster?
There is no primary source for that widely repeated figure that we could find, so it is withdrawn here and the channel's own numbers replace it.
In the video I say that channels publishing on a steady schedule "grow their subscribers around 67 percent faster, earn well over 100 percent more watch time, and get more than double the recommendations."
Those figures circulate widely on creator blogs. Writing this article I went looking for the study underneath them, and I could not find one that publishes a methodology, a sample or a date. I am not saying it is false. I am saying I repeated a number I could not stand behind, which is the thing this whole site exists not to do.
So here is what I can stand behind, which is our own channel's watch time by month in 2026, against the month the publishing push started.
Watch time ran at 443, 875, 644, 912, 525 and 871 minutes from January to June. In July, the first full month of publishing at volume, it hit 3,747 minutes. In the first twelve days of August alone it reached 1,720, which is more than any complete month in the first half of the year.
That is a four-fold jump that coincides exactly with the change in output. It is one channel and one month, so it is evidence rather than proof, and I would treat anyone presenting a single-channel result as a law with suspicion. But it is a real measurement with a date on it, which the 67 percent figure is not.
There is a harder finding sitting next to it, and this one genuinely changed our plan.
We measured how a video's watch time accrues over its life. About 70 percent of it arrives in the first seven days and about 95 percent by day 28. After day 28 the figure we measured was 0.0 percent. Videos aged 75, 103, 104, 105 and 108 days have earned nothing since their first week.
There is no back catalogue annuity here. Total watch time equals the sum of independent 28-day bursts, which means the library is not an asset that pays you, it is a record of bursts you already had. That is why stopping in 2024 dropped us to the floor in ninety days, and it is why the only lever on the number is what you publish next.
If your channel is search-led rather than browse-led your curve will look different, and evergreen tutorial content genuinely does have a tail. Ours does not, and I would rather know that than assume otherwise.
Do subscribers matter when reviving a YouTube channel?
Less than you think. The channel lost more subscribers than it gained in every month of 2026, 8 net losses and minus 461 on the year, while watch time climbed.
Here is the least comfortable table in the article. Subscribers gained and lost, by month, 2026.
| Month | Gained | Lost | Net |
|---|---|---|---|
| January | 43 | 109 | minus 66 |
| February | 72 | 102 | minus 30 |
| March | 43 | 86 | minus 43 |
| April | 45 | 115 | minus 70 |
| May | 17 | 88 | minus 71 |
| June | 24 | 120 | minus 96 |
| July | 73 | 121 | minus 48 |
| August 1 to 12 | 16 | 53 | minus 37 |
Eight months, eight net losses, minus 461 on the year. In the thirty days to 13 August we published 107 videos, gained 15,085 views, and finished the month with 100 fewer subscribers than we started it with.
I could have left that out. I am including it because it is the clearest evidence I have for the argument the video makes, and because it will be true of your channel too if you inherited an audience from an era you have moved on from.
Those 58,800 subscribers were earned by a different channel making different videos. Most of them will never watch anything I publish now, and while they sit there they drag down exactly the signal that decides whether a new video gets recommended. Our subscriber-sourced views had an average view percentage of 20.15 percent and our notification-driven views 12.6 percent, both lower than views from strangers arriving through search or an external link.
A subscriber who does not watch is not neutral. I would take 100 people who show up over 100,000 who forgot they followed me, and the analytics above are the reason that is a measurement rather than a slogan.
What are the YouTube Partner Program requirements from 2027?
From 1 February 2027, new applicants need 8,000 qualified watch hours instead of 4,000; existing partners are explicitly unaffected.
If you are climbing toward monetization, this is the most time-sensitive thing on this page. I checked all of it against YouTube's own help documentation on 13 August 2026 rather than against other people's summaries.
Today's thresholds. Ad revenue requires 1,000 subscribers with 4,000 qualified watch hours in the last 12 months, or 1,000 subscribers with 10 million qualified Shorts views in the last 90 days.
From 1 February 2027, YouTube's own wording for new applicants is "8,000 qualified watch hours in the last 365 days, or 20M qualified Shorts views in the last 90 days, in addition to still needing 1k subscribers." The watch-hour requirement doubles and the Shorts requirement doubles. The subscriber count does not move. Existing partners are explicitly safe: "If you are already in YPP, your status is not impacted by this update." Creators already in the programme need to accept updated terms in YouTube Studio by 31 January 2027.
Two changes almost nobody is reporting yet. The same update introduces a continued-activity requirement to stay in the programme: "1,000 qualified watch hours in the past 365 days, or 1 million qualified Shorts views in the last 90 days, or 2 long-form videos or 5 Shorts uploaded every 90 days", with an extended 90-day window to get back into compliance if you drop below. And there is a new monthly floor for the Shorts Creator Pool of "10M qualified Shorts views over the last 90 days", which affects Shorts earnings only and not membership or other revenue.
Read that continued-activity rule carefully, because it is the part that would have caught this channel. Under it, going quiet the way I did in 2025 does not just cost you growth. It eventually costs you the programme.
For us the arithmetic is uncomfortable and I would rather publish it than posture. We need roughly 4,000 qualifying hours banked and accepted before that date. This year, across seven and a half months, our long-form videos have produced about 115 watch hours. We need something in the region of thirty-five times our entire year, in under six months, which is why the plan is two or more films a day and a target of twenty watch hours per film in its first 28 days rather than anything gentler.
It may not land. That is genuinely the position, and you will be able to read the result here either way. What is not in doubt is the shape of the decision: if you are starting a channel now and ad revenue is part of the plan, the difference between beginning this month and beginning in December is the difference between a 4,000-hour climb and an 8,000-hour one.
Worth knowing that none of it blocks the business. Sponsorships and affiliate income require no Partner Program membership at all, and for a lot of channels they end up larger than ad revenue anyway.
How do you keep going while a channel recovers?
Everything above is mechanics, and mechanics are not why channels die. Retention takes craft, craft takes revision, and revision takes output. Output alone is where people stop.
I did not go quiet in 2025 because I ran out of ideas. I went quiet because making a good video every week entirely alone is exhausting, and the exhaustion arrives long before the results do. That is the real cause of death for most channels and almost nobody names it, because "you need to be consistent" is easier to sell than "you need a way of working that you can still do in month nine."
What changed for me is that I stopped working alone. I build alongside Claude now: research, structure, scripting, turning the mess in my head into something watchable. Not to remove the judgement, which is still the whole job, but to remove the part of the work that was eating the week and none of the thinking. The 107 videos in thirty days above is what that looks like in practice, and I would not have got near it any other way.
Underneath it there is one loop that keeps the well full, and it is the reason I never run out of things to make.
- Learn something. Something you are genuinely curious about, not something a keyword tool told you to be curious about.
- Research it until you actually understand it. Primary sources, real numbers, the parts that contradict the popular version.
- Act on it and build the thing yourself. This is the step everyone skips, and it is the only one that produces material nobody else has.
- Teach it. Which is the video, and which is also how you find out what you did not understand.
Then it starts over. Learn, research, act, teach. It is the same loop this entire company came out of, and its useful property is that step three generates evidence, which means you are never sitting down to write a video with nothing but opinions.
Come and build the studio with me
If you want to try the working method before spending anything, start free. Our Build Your AI Team course walks you through building the first seat, the Writer, and the prompt pack is yours to keep. The Claude prompting course sharpens the underlying skill every seat depends on. Both are free, both are on video, and neither asks for a card.
When you want the whole crew rather than one seat, that lives at ideasrepay.com, and the walkthrough for this exact business is The One-Person Studio.
It is the build rather than an article about the build. Seventeen steps across five phases, click by click. You get the six role prompts to paste straight in, so the crew exists in an afternoon instead of a month of trial and error. You get the three-way niche fit test that sets your earnings ceiling before you make anything, the full pipeline run from a blank idea to a published video through the four gates you never hand over, the packaging and quality control checklists, the disclosure rules in plain language, and the route from your first upload through to monetization and diversified revenue. The Crew Build Kit and the Studio Operating Kit come as downloads, and the whole thing follows one operator from month zero to month fourteen so you can see the shape of a year rather than guessing at it.
One payment of $99 opens that walkthrough and every other one we have published, plus every one we publish after it, across all three verticals: online businesses, YouTube and content, and offline work in the real world. Downloads, templates and scripts are included in every blueprint, there are no renewals and no upsells, and you can email us while you build. That is launch pricing, and it moves to $199 after the first 500 members. There is a community building alongside you and I mentor through it personally.
If you want the full picture of the AI-assisted channel model first, AI YouTube Automation Gets Channels Terminated is the pillar, including what YouTube actually banned and what it did not. And if the quiet months are the part you are worried about, I Made $0 for Months is the honest account of that stretch.
The channel is not back yet. It is 162 watch hours into a 4,000-hour climb with under six months on the clock, and I have published the number every month so far. Come and watch whether it works.