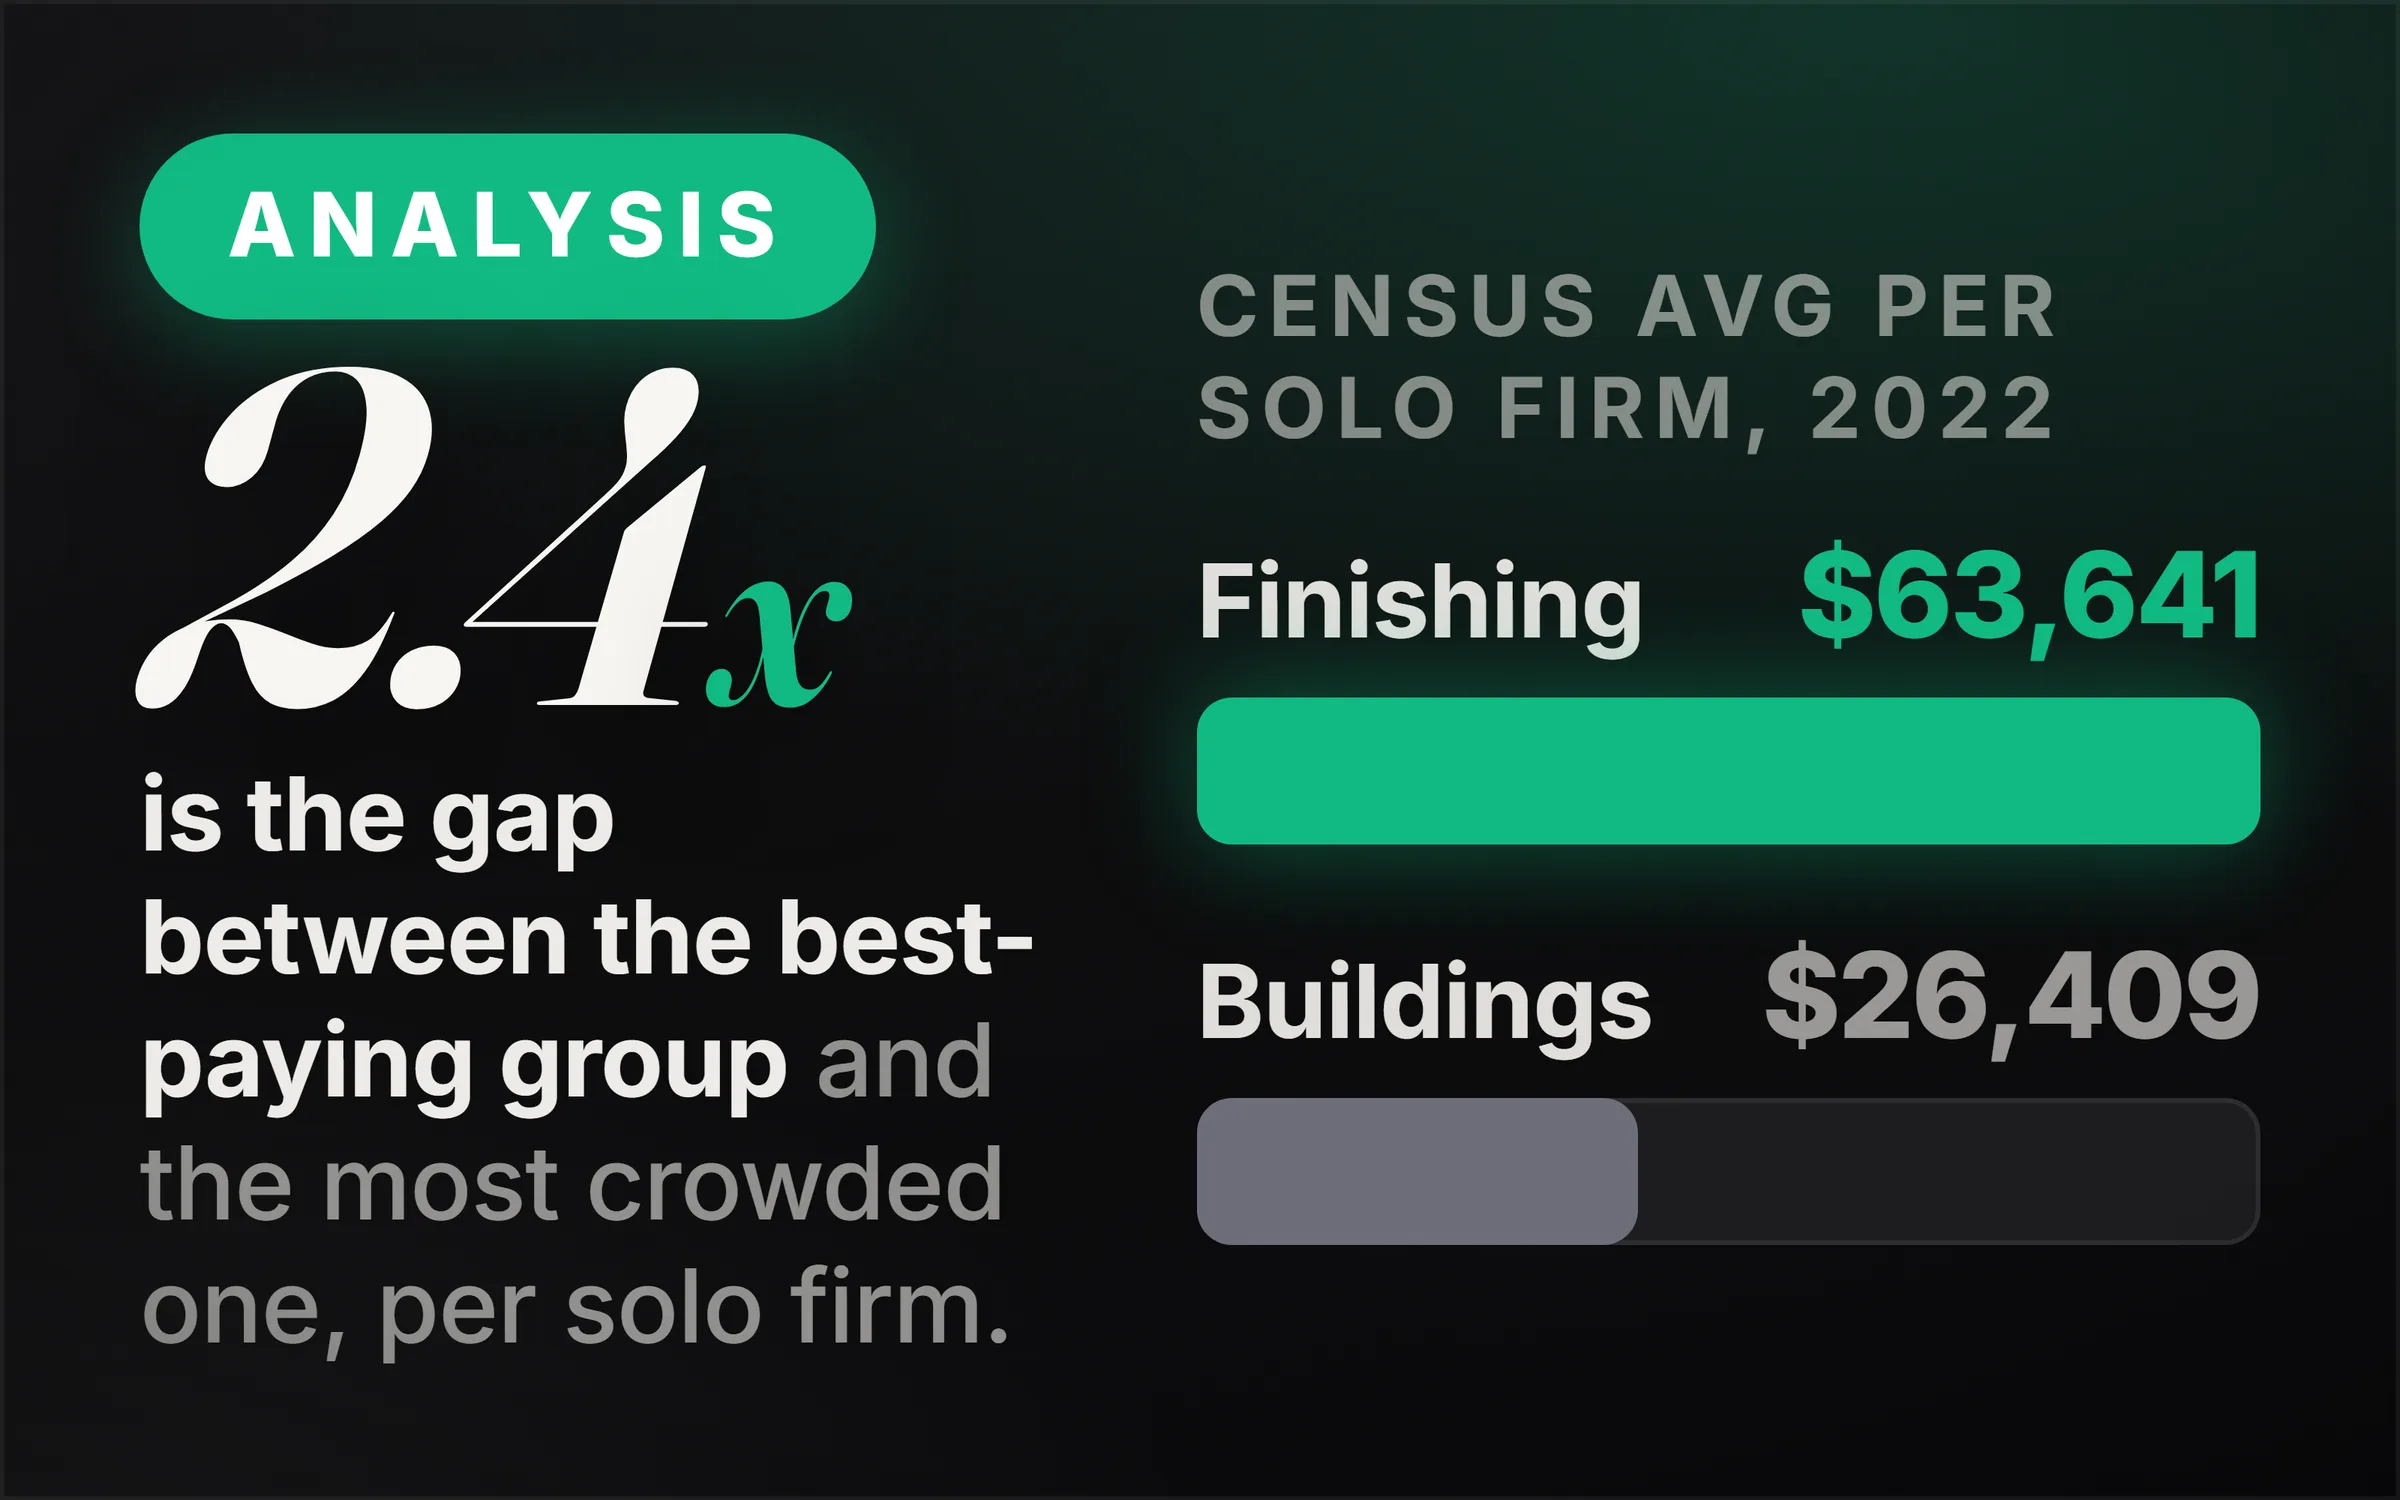
The highest-revenue boring business in the published data is building finishing work, which is painting, drywall and flooring. The average solo operator in that industry took in $63,641 in 2022. The lowest of the five we pulled is cleaning and landscaping at $26,409. That is a 2.4 times difference between two trades that look, from the outside, like similar amounts of physical work for local customers.
One correction before the table, because it is the whole reason this article exists. You cannot look up profit margins for small businesses, because nobody collects them. Every margin percentage circulating in this genre is either a guess or a franchise's own marketing. What the Census Bureau does publish is receipts per firm, across every registered business with no employees, and that is the closest honest measure available. It is revenue, not profit, and everything below is labelled as such.
Which boring businesses make the most money?
Here are five industries, all from Census Bureau Nonemployer Statistics for 2022, where "nonemployer" means a registered business with no paid employees. The figure is total receipts divided by the number of firms.
Average revenue per solo firm, 2022
- Building finishing contractors (NAICS 2383): $63,641 across 679,793 firms. Painting, drywall, flooring, tiling.
- Architectural and engineering services (NAICS 5413): $60,687 across 235,897 firms.
- Computer systems design (NAICS 5415): $59,133 across 342,033 firms. Web development, IT services.
- Other professional, scientific and technical services (NAICS 5419): $58,290 across 1,186,677 firms. Photography, marketing consulting, translation.
- Services to buildings and dwellings (NAICS 5617): $26,409 across 1,757,318 firms. Cleaning, landscaping, pest control.
The four industries at the top cluster tightly between $58,000 and $64,000, and the fifth sits at less than half of any of them. That is the striking feature of this data. It is not a smooth ladder, it is a cliff, and cleaning and landscaping are alone at the bottom.
These are industry groups rather than individual trades, because the Census does not publish six-digit detail at national level for nonemployer firms. So NAICS 2383 is painting alongside drywall and flooring, and 5617 is cleaning alongside landscaping. They are the closest published populations, not exact matches for a single job.
Why does the most crowded industry pay the least?
Because barriers to entry and revenue per operator move in opposite directions, and this dataset shows it cleanly. Services to buildings has 1,757,318 solo firms, more than twice as many as building finishing's 679,793, and it produces 2.4 times less revenue per firm.
The mechanism is not mysterious. Cleaning requires no credential, no tools beyond domestic equipment, and no skill a customer can verify in advance, so anyone can enter this week and many do. Painting and drywall require actual craft, produce a visible result a customer can judge, and carry a real cost to doing badly, so fewer people enter and those who do can charge more.
The uncomfortable implication is that the businesses easiest to start are the ones hardest to make money in, and they are easiest to start precisely because everyone else already worked that out. The advice to pick a low-barrier business because it is accessible is describing the mechanism that suppresses its earnings.
There is a second reading that is more useful. The cliff is between work priced against the customer's own time and work priced against a specialist's. Anyone can clean their own house, so cleaning competes against not hiring anyone. Almost nobody can plaster a wall properly, so plastering competes against other plasterers.
Is a solo business better than the job?
Not always, and this is the finding worth sitting with. Set each industry's average solo revenue against the BLS median wage for the equivalent occupation, as of May 2025.
Solo business revenue against the employed median wage
- Building finishing $63,641 against painters at $49,400. The business is 29 percent ahead.
- Other professional and technical $58,290 against photographers at $44,660. The business is 31 percent ahead.
- Services to buildings $26,409 against janitors and building cleaners at $36,840. The business is 28 percent behind.
- Computer systems design $59,133 against web developers and digital designers at $99,520. The business is 41 percent behind.
The web development row is the one that should stop you. It is the highest-paying occupation on this list by a wide margin, it is the one most commonly recommended as a route to going independent, and the average solo firm in its industry grosses barely more than half the median employed wage. Before costs, and before self-employment tax.
The comparison is not perfectly like for like. Business revenue is not take-home, and a wage is. That cuts against the businesses, making the two negative rows worse rather than better. On the other hand these averages include every part-time and abandoned registration, which drags them down in a way a full-time wage figure is not dragged.
What it establishes is a floor for honest expectations. In two of these five industries, the average person who went independent is behind the average person who did not.
Why does nobody publish profit margins?
Because no agency collects them for small businesses. The Census publishes receipts and firm counts. The IRS publishes tax data in aggregate forms that do not resolve to a usable margin by trade for solo operators. There is no national dataset of small business profit margins by industry, and there never has been.
That absence is filled by two things, and both are unreliable. Franchise marketing, which reports figures from franchisees selected by the franchisor, in a document designed to sell franchises. And content marketing, where a number appears in one article, gets cited by the next, and becomes established through repetition without ever having had a source. We wrote about that pattern in why your cold emails go to spam, and it works identically here.
So when you read that cleaning businesses run at a 20 percent margin or that pressure washing runs at 40, ask where it came from. Follow it and it terminates at somebody's blog. That is not a reason to despair of the question, it is a reason to use revenue per firm, which is measured, published, updated and free.
Are these industries growing or shrinking?
Growing on revenue, and in one case shrinking on headcount while revenue rises, which is the most attractive combination in the dataset.
Between 2019 and 2022, building finishing lost 1.1 percent of its solo firms, from 687,364 to 679,793, while average revenue per firm rose 20.6 percent, from $52,750 to $63,641. Fewer operators, each taking more. That is what a tightening supply of skilled trades looks like from the revenue side.
Over the same period, computer systems design grew firms by 0.9 percent and revenue per firm by 18.4 percent, from $49,928 to $59,133. Services to buildings grew firms by 7.6 percent and revenue per firm by 18.9 percent, from $22,220 to $26,409.
Two things follow. Revenue per solo operator rose by roughly a fifth across every industry we checked, so none of these is a declining market, and the saturation anxiety attached to all of them is not visible in the data. And the trade with falling headcount is the one with the highest revenue, which is the clearest argument in this article for choosing work that is hard to start rather than easy.
What should you actually take from this?
Pick for the barrier, not for the ease of starting. The single strongest pattern here is that revenue per operator tracks how hard the work is to enter, and the trades people recommend because "anyone can start tomorrow" are at the bottom for exactly that reason.
The second thing is that the averages are beatable and by a lot, because they include an enormous tail of part-time and abandoned registrations. In is a cleaning business profitable we worked out that beating the equivalent wage in that trade takes about 60 percent more revenue than the industry average, which is demanding but entirely specific. Every industry here has a version of that number, and knowing it is worth more than any margin claim.
The third is that none of this measures what the work is like. Building finishing pays best of the five and involves ladders, solvents and physical wear that ends careers. Computer systems design pays worst against its own wage alternative and is the most comfortable job on the list. Revenue per firm is one input into a decision that has several.
If the low-barrier lane is where you are starting anyway, start with the numbers in front of you: how to start a cleaning business has the full arithmetic for the hardest row in this table.
The honest hard part
The hard part is that industry averages describe a population you have not joined yet, and the temptation is to read them as a forecast about yourself.
They are not. A figure like $26,409 is the midpoint of an enormous distribution containing full-time operators with commercial contracts and people who registered a business, did three jobs and stopped. Nothing in that number tells you which one you would be. What it does tell you is the shape of the population and where the mass sits, which is genuinely useful and completely different from a prediction.
The other hard part is that the most decision-relevant number in this article does not exist. Nobody publishes what a solo operator keeps, and the gap between receipts and take-home is where the whole question actually lives. We have priced the verifiable part of that gap for one trade, which came to roughly 7.6 percent of revenue in software, insurance and card processing, in what it costs to start a cleaning business. The rest, which is supplies, vehicle and unpaid hours, differs so much between operators that any single figure would be fiction.
Which is the honest ending. This data tells you which rooms are worth walking into. It cannot tell you what you will find once you are inside, and anybody claiming otherwise is selling the room.
The individual trades behind these figures each have their own guide: painting, which tops the table, web design, which trails its own wage by the widest margin, photography, and lawn care.
The rest of the trades we costed on this data each have their own guide: junk removal, which tops everything we pulled, handyman work, moving, mobile detailing, laundry pickup and delivery, pressure washing, bin cleaning, and car rental, which is the one market here moving against the operator. The costs common to all of them are in the hidden costs nobody puts in a startup cost list.